Table of Contents
The Finance Toolbar is a popular application that provides real-time stock market data, financial metrics, and tools to help users track market trends directly from their desktops. With this app, users can monitor stock prices, view company financials, and customize settings to fit their specific needs for quick access to financial information.
This article will guide you through the steps to open the Options window in the Finance Toolbar app, where you can customize settings, adjust preferences, and tailor the toolbar’s display to match your personal finance-tracking requirements.
Finance Toolbar Windows App from the Microsoft Store:
https://apps.microsoft.com/detail/9wzdncrdqg5t
Finance Toolbar Mac App from the Mac App Store:
https://apps.apple.com/us/app/finance-toolbar-stock-ticker/id1044095759
How to open the Options window?
- Open the Finance Toolbar application
- Move your mouse on top of the 3 dots on the right side of the Finance Toolbar window (where you see the minimize and maximize icons)
- Now, move your mouse to the left side where you see the “wrench” icon. If you click on that “wrench” icon, it will open the Finance Toolbar Options window where you can customize the powerful application
Customize to your personal stocks and currencies
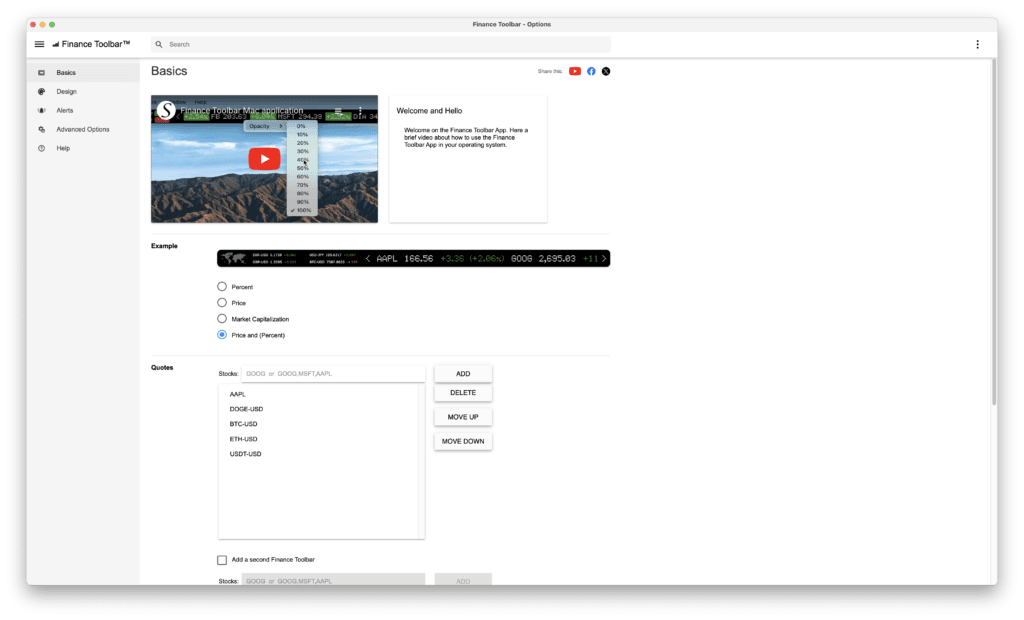
With the Finance Toolbar Options window open, you can choose the types of data you would like to display, such as percentage change, stock price, market capitalization, or a combination of price and percentage. Additionally, you can add or remove stocks to customize which ones appear in the toolbar.
